
Cyber risk quantification (CRQ) measures how likely a specific cyber loss scenario is and what its impact could be, using clear numbers. Teams use these numbers to compare risks and make decisions. Often, this means estimating financial impact, but downtime or the number of affected devices can also show impact.
A 2020 CISA review found that the average cost per cyber incident in U.S. commercial data ranged from $394,000 to $19.9 million, while the median was between $56,000 and $1.9 million. IBM’s 2026 Cost of a Data Breach Report, researched with the Ponemon Institute, puts the global average cost of a data breach at $4.99 million. Since extreme cases can distort averages and methods vary, teams should use evidence that matches their own situation instead of relying on general benchmarks.
This article covers the main methods and models using a practical example. DPOs, GRC leads, security teams, and risk owners can use it to check if a result supports their decision and if the evidence is strong enough.
Key takeaways
- CRQ expresses scenario likelihood or frequency and impact in measured units. An ordinal label or risk score is not automatically a measurement.
- Define the decision, event, assets, party boundary, time horizon, and loss categories before choosing a model.
- Ranges and probabilistic outputs need visible evidence, assumptions, sensitivity, and independent challenge.
- FAIR, Monte Carlo, ALE, VaR or exceedance views, and platforms occupy different categories.
- Quantified exposure informs decisions, but accountable people still decide acceptance, materiality, compliance, and action.
What is cyber risk quantification (CRQ)?
Cyber risk quantification measures a defined cyber loss scenario. It does not merely label it. Event likelihood or frequency and impact use explicit units: monetary value for financial comparison, or downtime, service interruption, and affected-device counts for operational decisions.
In the UK National Cyber Security Centre’s CRQ guidance, measured quantities differ from ordinal labels. The distinction turns on the units and how the result was derived, not on whether a number appears on a dashboard.
| Approach or object | What it examines | Units or output | Decision boundary |
| Qualitative analysis | Relative judgment about a scenario | Ordered categories such as low, medium, or high | Useful for structured judgment. The labels are not measured quantities |
| Semi-quantitative or ordinal scoring | Ranked categories, sometimes converted to numbers | Scores, bands, or heat-map positions | A numeric scale does not by itself measure event frequency or loss |
| Quantitative cyber risk analysis | A bounded cyber loss scenario | Frequency or probability plus monetary or nonmonetary impact, often as ranges | Supports comparison while preserving evidence and uncertainty |
| Broader cyber risk assessment | Context, assets, threats, vulnerabilities, likelihood, impact, and treatment | Findings and treatment decisions, with quantification as one possible component | Quantification does not replace the wider cyber risk assessment process |
| Privacy-risk analysis | Harms to individuals from data processing and downstream organizational effects | Privacy impacts, which can arise without a cybersecurity incident | Organizational cyber loss and individual privacy harm require distinct analysis |
The NIST Privacy Framework explains how privacy risk is different. Privacy risk is not just about security incidents. Analysis of harm to individuals is related to, but separate from, estimates of organizational cyber loss. The data privacy risk assessment guide covers the broader method, while the risk-register guide handles risk-register details.
Why quantify cyber risk, and what outputs does it produce?
Organizations quantify cyber risk so they can compare scenarios and security controls, guide resource allocation and security investments, and communicate risk in business terms. It also helps make uncertainty and risk tolerance clear. The decision owner uses this information but still makes the final call.
For practical work, CRQ supports four jobs:
- Prioritize scenarios by estimated cyber risk exposure rather than technical severity alone.
- Compare mitigation strategies through their modeled effects on frequency, impact, and residual exposure.
- Discuss resources and risk transfer in units that finance, business leaders, insurers, and risk owners can examine.
- Communicate uncertainty through ranges, assumptions, and probability-linked outputs instead of unsupported point estimates.
| Output | What it tells the reader | What it must not be read as |
| Frequency over a stated period | Expected number of defined loss events in that period | A promise that exactly that many events will occur |
| Probability over a stated period | Chance of at least one defined event, if framed that way | Frequency when multiple events are possible |
| Monetary or operational-impact range | Uncertainty in financial loss, downtime, affected devices, or another explicit unit | A precise known outcome |
| Annualized loss expectancy (ALE) | Mean modeled annual loss across the simulated outcomes | A guaranteed annual cost or worst case |
| Value at Risk (VaR) or an exceedance view | Loss at a stated percentile, or the chance of exceeding a threshold | Maximum possible loss |
| Residual-exposure estimate | Modeled exposure after the specified controls and assumptions | Automatic risk acceptance or proof that appetite has been satisfied |
How do you quantify cyber risk step by step?
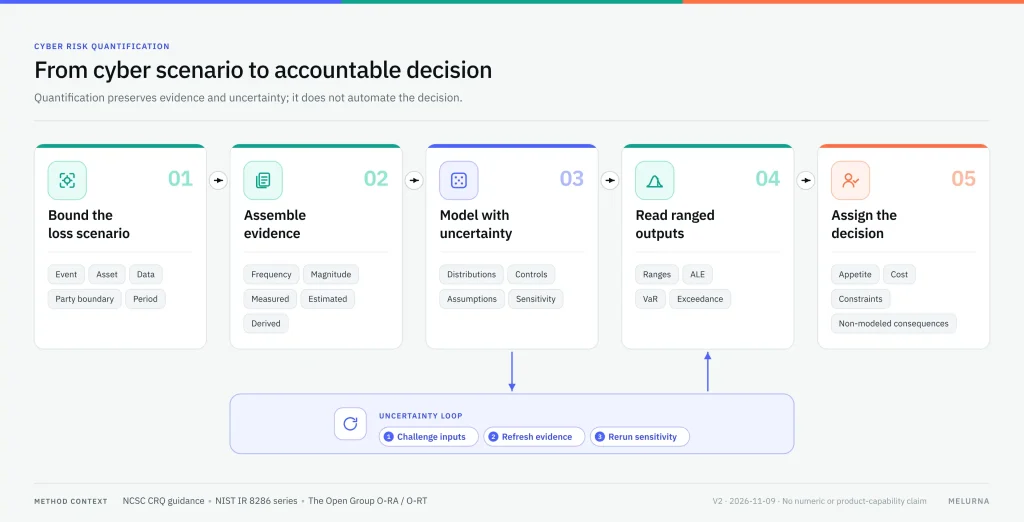
Start by defining the decision and scenario. Gather evidence, estimate how often and how big losses could be (including uncertainty), model the controls, check your calculations, and set who decides and when to review.
| Step | Reader action | Required record or check |
| 1 | Name the decision, owner, and time horizon. Bound one loss event against explicit assets, services, data, dependencies, and first-/third-party boundaries. | Decision statement, scenario boundary, owner, period, and exclusions |
| 2 | Define the threat event and affected confidentiality, integrity, or availability dimensions. Distinguish frequency, probability within a period, and loss magnitude conditional on an event. | Event definition, units, time basis, and relevant loss categories |
| 3 | Assemble asset and dependency context, threat intelligence and vulnerability evidence, controls, incident history, business-impact estimates, and expert judgment. | Source owner, observation date, coverage boundary, and evidence gaps |
| 4 | Classify inputs as measured, estimated, or derived. Estimate frequency and magnitude as ranges or distributions, using calibrated judgment and documented rationale where evidence is sparse. | Evidence class, range or distribution, assumptions, and limitations. The measured/estimated/derived terminology follows the FAIR Institute’s May 2025 Analyst’s Guide to Cyber Risk Data Sources, which is explicitly a draft for comment |
| 5 | Model current security controls before residual exposure. Distinguish prevention effects on frequency from mitigation effects on magnitude, then calculate and challenge the result. | Control assumptions, calculation settings, sensitivity tests, and double-counting checks |
| 6 | Interpret baseline and residual exposure against appetite, costs, constraints, and non-modeled consequences. Assign the decision and conditions that trigger another analysis. | Decision-owner action, accepted limitations, and scheduled or event-driven refresh triggers |
Before accepting the calculation, confirm:
- The scenario has one explicit event and time basis.
- Every input has a unit, source, observation date, evidence class, and transformation trail.
- Each relevant loss appears once, with affected-party harm distinguished from first-party response costs.
- Expert estimates show their rationale and uncertainty, and current controls, proposed controls, residual exposure, and risk appetite remain separate.
Among cyber risk assessment frameworks and methods, the NCSC basic assessment method supplies broader context, and the web-tracking guide covers stated versus observed evidence. This workflow owns cyber-specific quantification. An observation is not itself a frequency or loss estimate.
What does a cyber risk quantification example look like?
An example traces one illustrative scenario through a cyber risk quantification model, from inputs and assumptions to calculation, sensitivity, and a decision. These values are fictional. They are not industry benchmarks, predictions, customer results, or MELURNA telemetry.
In this scenario, an outside attacker uses stolen vendor credentials to gain unauthorized access to customer-support records and leak them in a data breach. The model looks at one year and includes first-party response and some secondary impacts. It does not include payment systems, production databases, or portfolio aggregation.
| Input or setting | Illustrative value | Role in the model |
| Exposed support records | 250,000 records | Fixed scenario-boundary count, not a count of affected individuals |
| Annual loss-event frequency | Triangular: minimum 0.10, mode 0.25, maximum 0.60 events/year | Frequency draw supplies the Poisson event-rate parameter |
| Response cost per record | Lognormal: median $18, sigma 0.45 | First-party response magnitude per exposed record |
| Operational interruption | Lognormal: median $120,000, sigma 0.50 per loss event | Customer-support interruption only |
| Legal, regulatory, and contractual response | Lognormal: median $80,000, sigma 0.65 per loss event | Simplified scenario-cost bucket. No jurisdiction-specific duty, penalty, materiality, or coverage conclusion |
| Lost business | Triangular: $20,000 / $75,000 / $250,000 per loss event | Simplified secondary-impact estimate |
| Proposed control assumptions | Frequency × 0.75. Every loss component × 0.90 | What-if multipliers, not guaranteed control performance |
The example uses 100,000 Monte Carlo simulations. For each simulated year, Poisson draws supply the number of loss events, and the model sums response, interruption, legal/regulatory/contractual, and lost-business costs.
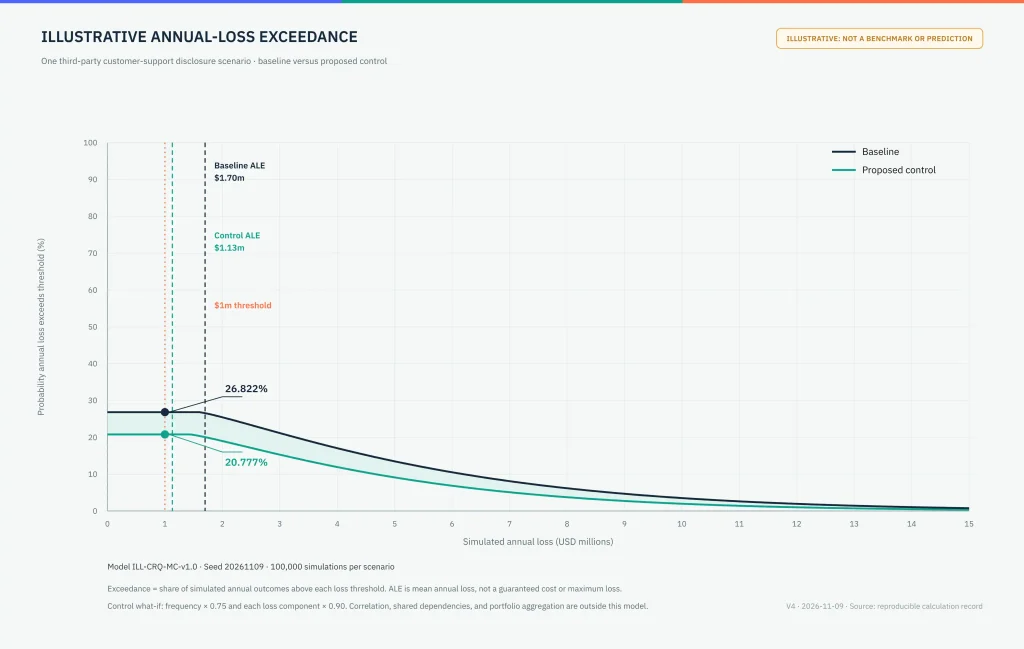
| Output | Baseline | Proposed control |
| ALE (USD/year) | $1,695,586.78 | $1,127,939.61 |
| Median annual loss | $0.00 | $0.00 |
| VaR 95 annual loss | $8,772,385.67 | $6,704,966.38 |
| P(loss > $1 million) | 0.268220 | 0.207770 |
| P(zero loss) | 0.731760 | 0.792210 |
The illustrative ALE change is $567,647.17. It is a modeled difference between assumptions, not guaranteed ROI or an automatic investment decision.
In one-way tests, annual frequency and all severity medians were changed by 20% up or down. ALE changed in line with the new assumptions, and exceedance probabilities mostly changed with frequency.
The decision owner should weigh control cost, modeled exposure change, non-modeled consequences, and risk appetite. This model does not separately account for control-effect uncertainty or shared dependencies. Update the analysis after any changes to vendor architecture, threats, controls, evidence, or decision scope.
Which cyber risk quantification models should you understand?
CRQ terminology spans different objects. The FAIR Institute’s CRQ overview explains the difference between quantitative values and ordinal scoring, and covers Monte Carlo and decision applications. This guide compares taxonomies and frameworks, probabilistic and loss-history methods, computation techniques, output summaries, threshold and tail views, and software tools.
| Category or item | What it consumes | What it returns | What it is not |
| Factor Analysis of Information Risk (FAIR) | A scoped loss scenario, evidence, estimates, and assumptions about loss event frequency and loss magnitude | A structured decomposition and analysis of scenario risk | A simulation technique, output metric, software product, or synonym for all CRQ |
| Monte Carlo simulation | Uncertain input distributions and calculation settings | Many possible outcomes and a distribution for analysis | A risk taxonomy or a guarantee that the inputs are correct |
| Bayesian approaches | Prior probability assumptions and new evidence | Updated probabilistic beliefs under an explicit model | A universal replacement for scenario definition or evidence validation |
| Actuarial or loss-history approaches | Relevant historical data on losses and exposure context | Empirically informed frequency or severity estimates where comparable observations are sufficient | Permission to treat unlike incidents or changing exposure as directly comparable |
| Annualized loss expectancy (ALE) | Modeled annual-loss outcomes | Expected annualized loss | A model family, guaranteed annual cost, or worst case |
| VaR and exceedance views | A loss distribution and a selected percentile or threshold | Probability-linked threshold or tail information | Maximum possible loss or a complete account of consequences |
| CRQ platform evaluation | Scenario data, integrations, models, and workflow configuration to inspect | Evidence about consistent analysis, reporting, and record-keeping within the implemented scope | Assuming automation independently validates the result |
Jack Jones originated FAIR (Factor Analysis of Information Risk), and the FAIR Institute, a nonprofit organization, develops and shares practices based on the model. The FAIR Institute’s January 2025 FAIR Model standard separates loss event frequency from loss magnitude and treats measurement as probabilistic and uncertain. The Open Group’s current O-RA 2.1 and O-RT 3.1 catalog records identify the current Open FAIR editions. Its May 2025 update announcement says the changes address CSF 2.0 governance alignment and consistency between the documents.
Pick the simplest qualitative, semi-quantitative, or quantitative method that provides defensible evidence and clearly shows uncertainty. Adding more computation will not fix a scenario that is unclear or based on weak evidence.
How can you use CRQ results reliably?
CRQ helps with prioritization and budgeting by comparing scenarios and modeled exposure changes to costs, assumptions, and non-modeled consequences. Specialists and decision owners are still responsible for decisions about materiality, insurance, compliance, acceptance, and risk transfer.
| Decision use | Decision-ready input | Owner and boundary |
| Prioritize remediation or budget | Baseline and residual-exposure ranges, control cost, estimated risk reduction, key drivers, and assumptions | The decision owner weighs the estimate against operational constraints and non-modeled consequences. Modeled change is not guaranteed ROI |
| Report to executive leadership or a board | Exposure range, trend, material drivers, uncertainty, control status, proposed action, and named owner | A dashboard figure without assumptions or a decision request is incomplete decision support |
| Inform insurance or risk-transfer discussions | Defined scenario, frequency and severity assumptions, loss categories, controls, and residual exposure | Insurers and relevant specialists assess terms, exclusions, coverage, and transfer choices. CRQ alone does not determine coverage |
| Support materiality or compliance work | Documented exposure estimates, evidence, and scenario-specific impacts | Legal, finance, privacy, and compliance specialists make their determinations. CRQ does not establish materiality or compliance by itself |
| Examine third-party exposure | Vendor and dependency boundary, affected services/data, first-party response, and applicable secondary impacts | Vendor-diligence mechanics remain with the third-party privacy risk management guide |
What makes a CRQ result reliable enough to use?
A result is decision-fit only when its scenario, units, evidence, transformations, ranges, assumptions, independent challenge, model history, and refresh triggers are visible and tested. Automation, real-time presentation, and mathematical sophistication do not establish reliability.
| Failure mode | Validation test | Accountable participant |
| Scenario or unit mismatch | Reconcile the event, assets, party boundary, time horizon, frequency/probability definition, and impact units | Scenario owner with the risk analyst |
| Ordinal scores treated as measurements | Inspect what the scale represents and whether it measures scenario frequency and impact | Method owner |
| Hidden evidence or transformations | Trace the path from source observation to normalized input and output | Evidence owner and model reviewer |
| Sparse data presented with false precision | Inspect ranges, calibration rationale, limitations, and sensitivity | Estimator with independent challenge |
| Double-counted losses or dependencies | Trace each loss category, common event, and secondary impact across scenarios | Risk analyst with finance or business owners |
| Automation treated as validation | Rerun the model, inspect settings and versions, and challenge the inputs independently | Independent model reviewer |
| Stale analysis treated as current | Test the last validation date against scheduled review and material-change triggers | Model owner and decision owner |
For cyber risk management governance:
- Include asset owners, security and risk practitioners, relevant privacy or legal specialists, finance, business owners, and the decision owner within their actual expertise.
- Name the person responsible for each material assumption, override, and approval.
- Preserve model and assumption versions, reviewer findings, and their dispositions.
- Refresh at a program-appropriate interval and after material changes to cyber threats, assets, dependencies, controls, evidence, or the decision context. No universal quarterly cadence applies.
- Compare modeled expectations with observed incidents, losses, control performance, and other relevant outcomes, then revisit the assumptions.
- Record what remains uncertain or outside the model so the decision owner can weigh it explicitly.
The NIST SP 800-30 Rev. 1 assessment guide supports explicit purpose, scope, assumptions, information sources, documentation, and maintenance. These controls make an analysis reviewable, not certain.
Can you trace every CRQ input back to evidence?
A defensible CRQ record links each scenario variable to whether it is measured, estimated, or derived, its exact source and observation date, any transformations, uncertainties, assumptions, override owner, model version, reviewer, how current it is, and any coverage gaps. This lets reviewers check the output and tell observation from inference.
For data-related scenarios, MELURNA monitors sensitive data across websites, applications, and customer journeys without agents or integrations, and reveals hidden vendors, AI services, downstream recipients, and changes over time. These observed journeys and first-, third-, and fourth-party dependencies can inform scenario boundaries and selected evidence inputs. Request a data-risk review for one scenario.
Should you quantify cyber risk manually, with advisors, or with a platform?
Manual analysis fits selective decisions and available expertise. Advisors add specialist modeling or challenge. For a platform, test its analysis and integrations in a pilot on your own scenario. Every option still requires evidence and assumption inspection.
| Operating model | Where it can fit | What to test before relying on it |
| Manual analysis or spreadsheets | Selective scenarios, limited decision frequency, and available internal modeling expertise | Formula inspection, version control, independent challenge, and sustainable maintenance |
| Advisory services | Specialist modeling, calibration, facilitation, or an independent challenge to internal work | Scenario and evidence transparency, transferable records, ownership after handoff, and accessible methods |
| CRQ platform | Repeated decisions, integrations, standardized workflows, and retained analysis history | Scenario fit, source transparency, data coverage and freshness, exports, overrides, versions, and validation support |
For any option, run four checks:
- Trace source evidence, observation dates, coverage gaps, and transformations for one bounded scenario.
- Change one material assumption and compare the output and sensitivity.
- Inspect model and assumption history, override permissions, and reviewer records.
- Export the scenario, inputs, settings, and outputs, and verify how integrations affect evidence coverage and freshness.
What should you do next?
Start with one decision-relevant scenario and document its evidence and assumptions. Then choose the resource that matches the remaining task:
- For broader assessment or individual privacy harm, read the data privacy risk guide.
- For ordinal scoring and register mechanics, read the risk-register guide.
- For vendor scenarios and dependency work, read the third-party privacy risk management guide.
- Detailed FAIR, model-selection, and tool-selection companions remain planned and unlinked until their destinations are published and confirmed.
- For program-level ownership and governance, read the data risk management framework guide.
DISCLAIMER: This article is for general informational purposes only and does not constitute legal advice. While we strive for accuracy, we make no warranties about the completeness or reliability of this information, and are not liable for any errors, omissions, or actions taken based on its contents. Consult a licensed attorney for guidance specific to your business.